Skip to content

Search results for 'hydraulic conductivity'

Estimating Relative Humidity in Soil: How to Stop Doing it Wrong

Estimating the relative humidity in soil?  Most people do it wrong…every time.  Dr. Gaylon S. Campbell shares a lesson on how to correctly estimate soil relative humidity from his new book, Soil Physics with Python, which he recently coauthored with Dr. Marco Bittelli.

Desert with trees and brush everywhere

Radioactive waste buried in steel containers will corrode if the humidity is too high.

A number of years ago a former student told me of a meeting he had with some engineers establishing a low-level radioactive waste repository in a desert area. The waste was to be buried, and at least some of it was in steel containers which would corrode if the humidity was too high. The engineers assumed the humidity in the soil would be pretty low because it was a desert, but they didn’t know how low. So, what is the relative humidity in soil? That sounds like it would be a hard thing to find out without measuring it, but it isn’t. Let’s apply a little physics to see what we can find.

The energy required to create an infinitesimal volume of water vapor can be found using the first law of thermodynamics. For an adiabatic system

Thermodynamics Equations

where dE is the energy required, p is the pressure, and dV is the volume change.

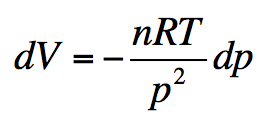
The Boyle-Charles law, which gives the pressure-volume relationship for a perfect gas, is

Thermodynamics Equations

where n is the number of moles of gas, R is the universal gas constant, and T is the kelvin temperature. Rearranging terms and taking the derivative of both sides gives

Thermodynamics Equations

This equation can be substituted for dV in the first equation, giving

Thermodynamics Equations

The total energy required to go from a reference vapor pressure, po (the vapor pressure of pure water) to the vapor pressure of the water in the soil, p is

Thermodynamics Equations

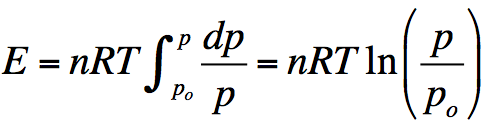
We can divide both sides by the mass of water. The left side then becomes the energy per unit mass of water in the soil, which we call the water potential. On the right side, the number of moles per unit mass is the reciprocal of the molecular mass of water, and the ratio of the vapor to the saturation vapor pressure is the relative humidity hr so the final equation is

Thermodynamics Equations

We can rearrange this and take the exponential of both sides, giving

Thermodynamics Equations

In the second version of the equation the molecular mass of water, the gas constant and the temperature (298K) have been substituted.

We can use this equation to find the range of humidities we would expect in soil. When soil is very wet, the water potential is near 0, so the humidity is exp(0) = 1. At the dry end, the soil is dried mainly by plant water uptake. Even desert soils support some vegetation. The soil near the surface will be dried by evaporation, but a few decimeters below the surface the lowest water potentials are those to which plants can dry them. The nominal permanent wilting point (lower limit of plant available water) is -1500 J/kg. Desert vegetation can extract water to lower potentials. If we say their lower limit is -2500 J/kg, then the humidity is

Thermodynamics Equations

so the relative humidity in the soil is around 98%. Sagebrush can go lower than -2500 J/kg. We measured -7000 J/kg under it at the end of the growing season. Even that, though, is around 95% humidity.

The conclusion is that the humidity in the soil is always near saturation, except in a shallow evaporation layer near the surface. I don’t remember what the engineers were expecting. I think anything above 60 or 70% was going to be a disaster for corroding the steel containers. I don’t know whether they believed the calculations or just went on thinking that desert soil is dry.

Take our Soil Moisture Master Class

Six short videos teach you everything you need to know about soil water content and soil water potential—and why you should measure them together.  Plus, master the basics of soil hydraulic conductivity.

Watch it now—>

Download the “Researcher’s complete guide to water potential”—>

Download the “Researcher’s complete guide to soil moisture”—>

Get more information on applied environmental research in our

Reforestation in the Philippines (Part 1)

In the mountainous Benguet province of the Philippines, farmers grow up to three crops of vegetables a year. Their mountain vegetable farms exist at the expense of original forest cover, causing tremendous erosion difficulties. To counteract erosion and preserve the watershed as well as promote reforestation, the Philippine government issued a mandate: farmers must find alternatives that restore the watershed or lose their land.

Arial view of rice terraces in the Philippines

Rice terraces in the Philippines

An Agroforestry Alternative

Loreca Stauber is no scientist, but she loves Benguet, and a letter from her friend, a scientist living in the Philippines, inspired her with the vision of teaching farmers to reforest the mountains and grow vegetables amongst the trees.  

Her friend writes, “We envision mountain farms as forest ecosystems whose primary social responsibility to the communities around and below is to be part of responsible watersheds that court, catch, store and gradually share water. We see mountain farms that are not prone to soil erosion or leaching: cultivated with minimal chemical inputs and tillage that will allow the natural buildup of biomass, organic matter, helpful organisms and fauna. We think of forest ecosystems that may not make millionaires of its farmers for one generation and heavy debtors even before the next. Rather, we envision forest farm ecosystems that are self-sufficient and self-sustaining. We are working on demonstrating forest ecosystems that can substitute for monocrop vegetable farms that deplete and leach the soil, pollute watersheds and are self-destructing.”  

Realizing the problem in the Philippines could be solved by reforestation, Loreca emailed Dr. Anthony S. Davis, Tom Alberg and Judi Beck Chair in Natural Resources in the University of Idaho’s Department of Forest, Rangeland, and Fire Sciences.  The U of I operates a 100-year-old nursery specializing in growing hardy tree seedlings. Dr. Davis recalls, “The email she sent me said, “I think you should do something about this,”  and I thought, “Actually I agree. I think we should do something about this.  So we began to screen the idea, asking: are there partners?  Is it a good idea?  Does it fit with this little thing that we do really well, which is essentially teaching people how to grow tree seedlings, and is there an educational component that’s valuable for our students?  When those check boxes lined up, then it was a matter of taking advantage of that opportunity and seeing where it could go.”

Green forested mountains in the Philippines

Forested mountains in the Philippines

Determining What Already Works

Together, they and other partners started a program in which U of I students went overseas to teach the people of Benguet how to grow trees, with the goal of moving the land toward agroforestry.  They wanted to grow a forest ecosystem (trees, shrubs, and ground cover) along with annual crops. Kea Woodruff, former U of I Nursery Production and Logistics Associate, now at Harvard University, traveled to the Philippines with an interdisciplinary team of undergraduate and graduate students to look at what agroforestry projects were already working and to conduct a needs assessment.    She says, “I saw a wide variety of landscapes in the areas that we were. One woman decided on her own that she was going to practice agroforestry, and people come and view her land as a demonstration site. It has mature bamboo, coffee trees, and mature Benguet pine. It really looks like what you would expect the native forest to look in an area like the Philippines.”

Kea said there were also intermediate sites where there are Benguet pines and some coffee with row crops blended in, such as strawberries and squash. She adds, “There’s clearly great potential to grow different species on these lands if we can help figure out the best way to use the resources that are available.”

Next week: Learn how partners in the project have been able to use native resources in the quest to reforest erosion-plagued Benguet.

Take our Soil Moisture Master Class

Six short videos teach you everything you need to know about soil water content and soil water potential—and why you should measure them together.  Plus, master the basics of soil hydraulic conductivity.

Watch it now—>

Download the “Researcher’s complete guide to soil moisture”—>

Download the “Researcher’s complete guide to water potential”—>

Get more information on applied environmental research in our

Screening for Drought Tolerance

Screening for drought tolerance in wheat species is harder than it seems.  Many greenhouse drought screenings suffer from confounding issues such as soil type and the resulting soil moisture content, bulk density, and genetic differences for traits like root mass, rooting depth, and plant size. In addition, because it’s so hard to isolate drought stress, some scientists think finding a repeatable screening method is next to impossible. However, a recent pilot study done by researcher Andrew Green may prove them wrong.

An automatic irrigation setup with green plants sticking out

Automatic Irrigation Setup

The Quest for Repeatability

Green says, “There have been attempts before of intensively studying drought stress, but it’s hard to isolate drought stress from heat, diseases, and other things.”  Green and his advisors, Dr. Gerard Kluitenberg and Dr. Allan Fritz, think monitoring water potential in the soil is the only quantifiable way to impose a consistent and repeatable treatment. With the development of a soil-moisture retention curve for a homogeneous growth media, they feel the moisture treatment could be maintained in order to isolate drought stress.  Green says, “Our goal is to develop a repeatable screening system that will allow us to be confident that what we’re seeing is an actual drought response before the work of integrating those genes takes place, since that’s a very long and tedious process.”

Why Hasn’t This Been Done Before?

Andrew Green, as a plant breeder, thinks the problem lies in the fact that most geneticists aren’t soil scientists. He says, “In past experiments, the most sophisticated drought screening was to grow the plants up to a certain point, stop watering them, and see which ones lived the longest. There’s never been a collaborative approach where physiologists and soil scientists have been involved.  So researchers have imposed this harsh, biologically irrelevant stress where it’s basically been an attrition study.” Green says he hopes in his research to use the soil as a feedback mechanism to maintain a stress level that mimics what exists in nature.

Data acquisition a cabinet setup for green's expanded experiment

Data Acquisition Cabinet setup for Green’s expanded experiment.

The Pilot Study

Green used volumetric water content sensors, matric potential sensors, as well as column tensiometers to monitor soil moisture conditions in a greenhouse experiment using 182 cm tall polyvinyl chloride (PVC) growth tubes and homogenous growth media. Measurements were taken four times a day to determine volumetric water content, soil water potential, senescence, biomass, shoot, root ratio, rooting traits, yield components, leaf water potential, leaf relative water content, and other physiological observations between moisture limited and control treatments.  

Soil Media:  Advantages and Disadvantages

To solve the problem of differing soil types, Andrew and his team chose a homogeneous soil amendment media called Profile Greens Grade, which has been extensively studied for use in space and other applications.  Green says, “It’s a very porous material with a large particle size.  It’s a great growth media because at the end of the experiment you can separate the roots of the plant from the soil media, and those roots can be measured, imaged, and studied in conjunction with the data that is collected.”   Green adds, however, that working with soil media isn’t perfect: there have been hydraulic conductivity issues, and the media must be closely monitored.

What’s Unique About this Study?

Green believes that because the substrate was very specific and his water content and water potential sensors were co-located, it allowed him to determine if all of his moisture release curves were consistent.  He says, “We try to pack these columns to a uniform bulk density and keep an eye on things when we’re watering, hoping it’s going to stay consistent at every depth.  So far it’s been working pretty well: the water content and the water potential are repeatable in the different columns.”

Irrigation setup for the expanded study with research data cabinet

Entire Irrigation setup for the expanded study.

Plans for the Future

Green’s pilot study was completed in the spring, and he’s getting ready for the expanded version of the project:  a replicated trial with wild relatives of wheat. He’s hoping to use soil moisture sensors to make automatic irrigation decisions: i.e. the water potential of the columns will activate twelve solenoid valves which will disperse water to keep the materials in their target stress zone, or ideal water potential.

The Ultimate Goal

The ultimate goal of Green’s research is to breed wild species of wheat into productive forms that can be used as farmer-grown varieties. He is optimistic about the results of his pilot study.  He says, “Based on the very small unreplicated data that we have so far, I think it is going to be possible to develop a repeatable method to screen these materials.  With the data that we’re seeing now, and the information that we’re capturing about what’s going on below ground, I think being able to hold these things in a biologically relevant stress zone is going to be possible.”

Take our Soil Moisture Master Class

Six short videos teach you everything you need to know about soil water content and soil water potential—and why you should measure them together.  Plus, master the basics of soil hydraulic conductivity.

Watch it now—>

Download the “Researcher’s complete guide to soil moisture”—>

Download the “Researcher’s complete guide to water potential”—>

Get more information on applied environmental research in our

Water Potential/Water Content:  When to Use Dual Measurements

In a previous post, we discussed water potential as a better indicator of plant stress than water content.  However, in most situations, it’s useful to take dual measurements and measure both water content and water potential.  In a recent email, one of our scientist colleagues explains why: “The earlier article on water potential was excellent.  But what should be added is an explanation that the intensity measurement doesn’t translate directly into the quantity of water stored or needed. That information is also required when managing water through irrigation.  This is why I really like the dual measurement approach. I am excited about the possibilities of information that can be gleaned from the combined set of water content, water potential, and spectral reflectance data.”

Field plantation with a sprinkler in the middle of it

Potato field irrigation

Managing Irrigation

The value of combined data can be illustrated by what’s been happening at the Brigham Young University Turf Farm, where we’ve been trying to optimize irrigation of turfgrass (read about it here). As we were thinking about how to control irrigation, we decided the best way was to measure water potential.  However, because we were in a sandy soil where water was freely available, we also guessed we might need water content. Figure 1 illustrates why.

Turf farm data concerning water potential diagram

Figure 1: Turf farm data: water potential only

Early water potential data looks uninteresting; it tells us there’s plenty of water most of the time, but doesn’t indicate if we’re applying too much.  In addition, if we zoom in to times when water potential begins to change, we see that it reaches a stress condition quickly.  Within a couple of days, it is into the stress region and in danger of causing our grass to go into dormancy.  Water potential data is critical to be able to understand when we absolutely need to water again, but because the data doesn’t change until it’s almost too late, we don’t have everything we need.

Turf farm data dual measurements data diagram

Figure 2: Turf farm data, volumetric water content only

Unlike water potential, the water content data (Figure 2) are much more dynamic. The sensors not only show the subtle changes due to daily water uptake but also indicate how much water needs to be applied to maintain the root zone at an optimal level. However, with water content data alone, we don’t know where that optimal level is. For example, early in the season, we observe large changes in water content over four or five days and may assume, based upon onsite observations, that it’s time to irrigate. But, in reality, we know little about the availability of water to the plant. Thus, we need to put the two graphs together (Figure 3).

Water potential and vol. water content diagram

Figure 3: Turfgrass data: both water potential and volumetric water content together.

In Figure 3, we have the total picture of what’s going on in the soil at the BYU turf farm. We see the water content going down and can tell at what percentage the plants begin to stress.  We also see when we’ve got too much water: when the water content is well above where our water potential sensors start to sense plant stress. With this information, we can tell that the turfgrass has an optimal range of 12% to 17% volumetric water content. Anything below or above that range will be too little or too much water.  

Soil water potential and volumetric water content diagram

Figure 4: Turfgrass soil moisture release curve (black). Other colors are examples of moisture release curves for different types of soil.

Dual measurements will also allow you to make in situ soil moisture release curves like the one above (Figure 4), which detail the relationship between water potential and water content.  Scientists can evaluate these curves and understand many things about the soil, such as hydraulic conductivity and total water availability.

Download the “Researcher’s complete guide to water potential”—>

Download the “Researcher’s complete guide to soil moisture”—>

Get more information on applied environmental research in our

Water Potential Versus Water Content

Dr. Colin Campbell, soil physicist, shares why he thinks measuring soil water potential can be more useful than measuring soil water content.

A horsetail plant showing possible signs of guttation where the water potential in the soil overnight is high enough to force water out of the stomates in the leaves.

A horsetail plant showing possible signs of guttation where the water potential in the soil overnight is high enough to force water out of the stomates in the leaves.

I know an ecologist who installed an extensive soil water content (VWC) sensor network to study the effect of slope orientation on plant available water.  He collected good VWC data, but ultimately he was frustrated because he couldn’t tell how much of the water was available to plants.

He’s not alone in his frustration. Accurate, inexpensive soil moisture sensors have made soil VWC a justifiably popular measurement, but as many people have discovered, a good hammer doesn’t make every soil water problem a nail. I like to compare water potential to temperature because both are considered “intensive” variables that define the intensity of something.

People often try to quantify their own environment, because those measurements define comfort and happiness.  Long ago, they discovered they could make an enclosed glass tube, put mercury inside, and infer this intensive variable called temperature from the changes in the mercury’s volume. This was an obvious way to define the comfort level of a human being.

Thermometer laying on top of wood

People discovered they could make an enclosed glass tube, put mercury inside, and infer an intensive variable called temperature.

They could have measured the heat content of their surroundings.  But they would have discovered that while heat content would be higher in a larger room and lower in a smaller room, you would feel the same comfort level in both rooms.  The temperature measurement helps you know whether or not you’d be comfortable without any other variables entering into the equation.

Similar to heat content, water content is an amount. It’s an extensive variable.  It changes with size and situation. Consider the following paradoxes:

  • A soil with fairly low volumetric water content can have plenty of plant-available water and a soil with high water content can have almost none.
  • Gravity pulls water down through the profile, but water moves up into the soil from a water table.
  • Two adjacent patches of soil at equilibrium can have significantly different water content.

In these and many other cases, water content data can be confusing because they don’t predict how water moves.  Water potential measures the energy state of water and thus explains realities of water movement that otherwise defy intuition. Like temperature, water potential defines the comfort level of a plant.   Similar to the room size analogy for temperature, if we know the water potential, we can know whether plants will grow well or be stressed in any environment.

sand with plants poking out and a blue sky in the background

Soil, clay, sand, potting soil, and other media, all hold water differently.

Plants don’t understand the concept of a content in terms of “comfort” because soil, clay, sand, potting soil, and other media, all hold water differently.  Imagine a sand with 30% water content. Due to its low surface area, the sand will be too wet for optimal plant growth, threatening a lack of aeration to the roots, and flirting with saturation.  Now consider a fine textured clay at that same 30% water content. The clay may appear only moist and be well below optimum “comfort” for a plant due to the surface of the clay binding the water and making it less available to the plant.

Water potential measurements clearly indicate plant available water, and, unlike water content, there is an easy reference scale. We know that plant optimal runs from about -2-5 kPa which is on the very wet side, to about -100 kPa, at the drier end of optimal.  Below that plants will be in deficit, and past -1000 kPa they start to suffer.  Depending on the plant, water potentials below -1000 to -2000 kPa cause permanent wilting.

So, why would we want to measure water potential? Water content can only tell you how much water you have.  If you want to know how fast water can move, you need to measure hydraulic conductivity.  If you want to know whether water will move and where it’s going to go, you need water potential.

Learn more

Soil moisture is more than just knowing the amount of water in soil. Learn basic principles you need to know before deciding how to measure it. In this 20-minute webinar, discover:

  • Water content: what it is, how it’s measured, and why you need it
  • Water potential: what it is, how it’s different from water content, and why you need it
  • Whether you should measure water content, water potential, or both
  • Which sensors measure each type of parameter

Many questions about water availability and movement are best answered by measuring water potential.  To find out more, watch any of the virtual seminars below, or visit our new water potential website.

Download the “Researcher’s complete guide to water potential”—>

Water Potential 101: Making Use of an Important Tool

Water Potential 201:  Choosing the Right Instrument

Water Potential 301: How to Push Your Instruments Past their Specifications

Water Potential 401: Advances in Field Water Potential

Find out when you should measure both water potential and water content.

Take our Soil Moisture Master Class

Six short videos teach you everything you need to know about soil water content and soil water potential—and why you should measure them together.  Plus, master the basics of soil hydraulic conductivity.

Watch it now—>

Download the “Researcher’s complete guide to soil moisture”—>

What is the Future of Sensor Technology?

Dr. John Selker, hydrologist at Oregon State University and one of the scientists behind the Trans African Hydro and Meteorological Observatory (TAHMO) project, gives his perspective on the future of sensor technology.

Researcher Pointing to Something while Walking through a Forest

Dr. John Selker (Image: andrewsforest.oregonstateuniversity.edu)

What sparked your interest in science?

I was kind of an accidental scientist in a sense. I went into water resources having experienced the 1985 drought in Kenya. I saw that water was transformative in the lives of people there. I thought there were lots of things we could do to make a difference, so I wanted to become a water resource engineer. It was during my graduate degree process that I got excited about science.

What was the first sensor you developed?

I’ve been developing sensors for a long time.  I worked at some national labs on teams developing sensors for physics experiments. The first one I developed myself was as an undergraduate student in physics. I was the lab instructor for the class, and I wanted to do something on my own while the students were busy. I made a non-contact bicycle speedometer which was much like an anemometer. I took an ultrasonic emitter, trained it on the tire, and I could get the beat frequency between emitted sound and the backscatter to get the bicycle speed.

What’s the future of sensor technology?

Communication

Right now one of the very exciting advances in technology is communication. Having sensors that can communicate back to the scientists immediately makes a huge difference in terms of knowing how things are going, making decisions on the fly, and getting good quality data.  Oftentimes in the past, a sensor would fail and you wouldn’t know about it for months.  Cell phone technology and the ability to run a station on a few AA batteries for years has been the most transformative aspect of technological development.  The sensors themselves also continue to improve: getting smaller and using less energy, and that’s excellent progress as well.

A Picture of a Orange Maple Leaf in the middle of Fall

What often happens is that you install a solar sensor, and then a leaf or a dust grain falls on it, and you lose your accuracy.

Redundancy

I think the next big thing in sensing technology is how to use what we might call “semi-redundant” sensing.  What often happens is that you install a solar sensor, and then a leaf or a dust grain falls on it, and you lose your accuracy.  However, if you had a solar panel and a solar sensor, you could then do comparisons.  Or if you were using a wind sensor and an accelerometer you could also compare data. We now have the computing capability to look at these things synergistically.

Accuracy

What I would say in science is that if we can get a few more zeros: a hundred times more accurate, or ten times more frequent measurements, then it would change our total vision of the world.  So, what I think we’re going to have in the next few years, is another zero in accuracy.  I think we’re going to go from being plus or minus five percent to plus or minus 0.5 percent, and we are going to do that through much more sophisticated intercomparisons of sensors.  As sensors get cheaper, we can afford to have more and more related sensors to make those comparisons.  I think we’re going to see this whole field of data assimilation become a critical part of the proliferation of sensors.

What are your thoughts on the future of sensor technology?

Get more information on applied environmental research in our

Download the “Researcher’s complete guide to soil moisture”—>

Take our Soil Moisture Master Class

Six short videos teach you everything you need to know about soil water content and soil water potential—and why you should measure them together.  Plus, master the basics of soil hydraulic conductivity.

Watch it now—>

Do the Standards for Field Capacity and Permanent Wilting Point Need to Be Reexamined?

We were inspired by this Freakonomics podcast, which highlights the book, This Idea Must Die: Scientific Problems that are Blocking Progress, to come up with our own answers to the question:  Which scientific ideas are ready for retirement?  We asked METER scientist, Dr. Gaylon S. Campbell, which scientific idea he thinks impedes progress.  Here’s what he had to say about the standards for field capacity and permanent wilting point:

Canola Field right next to an eroded soil cliff

A layered soil, a soil that has a fine-textured horizon on top of a coarse-textured soil, will hold twice as much water as you’ll predict from the -⅓ bar value.

Idea:

The phrase, “this idea must die,” is probably too strong a phrase, but certainly some scientific ideas need to be reexamined, for instance the standard of -⅓ bar (-33 kPa) water potential for field capacity and -15 bars (-1500 kPa or -1.5 MPa) for permanent wilting point.

Where it came from:

In the early days of soil physics, a lot of work was done in order to establish the upper and lower limit for plant available water.  The earliest publication on the lower limit experiments was by Briggs and Shantz in 1913. They planted sunflowers in small pots under greenhouse conditions, letting the plants use the water until they couldn’t recover overnight, after which they carefully measured the water content (WC).  The ability to measure water potential came along quite a bit later in the 1930s using pressure plates.  As those measurements started to become available, a correlation was found between the 15 bar pressure plate WCs and the WCs that were determined by Briggs and Shantz’s earlier work.  Thus -15 bars (-1.5 MPa) was established as the lower limit of plant available water.  The source of the field capacity WC data that established a fixed water potential for the upper limit is less clear, but the process, apparently, was similar to that for the lower limit, and -⅓ bar was established as the drained upper limit water potential in soil.

Sunflowers against a blue sky

Briggs and Shantz planted sunflowers in small pots under greenhouse conditions, letting the plants use the water until they couldn’t recover overnight, after which they carefully measured the water content (WC).

Damage it does:  

In practice, using -15 bars to calculate permanent wilting point probably isn’t a bad starting point, but in principle, it’s horrible. Over the years we have set up experiments like Briggs and Shantz did and measured water potential. We have also measured field soils after plants have extracted all the water they can.  Permanent wilting point never once came out at -15 bars or -1.5 MPa.  For things like potatoes, it was approximately -10 bars (-1 MPa), and for wheat it was approximately -30 bars (-3 MPa).  We found that the permanent wilting point varies with the species and even with soil texture to some extent.

Of course, in the end it doesn’t matter much as the moisture release curve is pretty steep on the dry end, and whether you predict it to be 10 or 12% WC, it doesn’t make a huge difference in the size of the soil water reservoir that you compute.

However, on the field capacity end of the scale, it matters a lot.  If you went out and made measurements of the water potentials in soils a few days after a rain, it would be an absolute accident if any of them were ever -⅓ bar (-33 kPa).  I’ve never seen it.  A layered soil, a soil that has a fine-textured horizon on top of a coarse-textured soil, will hold twice as much water as you’ll predict from the -⅓ bar value.  On the other hand, if you’re getting pretty frequent rains or irrigation, that field capacity number becomes irrelevant. Thus, -⅓ bar may be a useful starting point for determining field capacity, but it’s only a starting point.

Why it’s wrong:

Field capacity and permanent wilting point are dynamic properties.  They depend on the rate at which the water is being extracted or the rate at which it’s being applied.  They also depend on the time you wait to sample after irrigation. Think of the soil as a leaky bucket.  If you were trying to carry water in a leaky bucket and you walked slowly, the bucket would be empty by the time you get the water where you want it. However, if you run fast, there will still be some water left in the bucket.  Similarly, if a plant can use water up rapidly, most of it will be intercepted, but if a plant is using water slowly, the water will move down past the root zone and out the bottom of the soil profile before the plant can use it.  These are dynamic phenomena that you are trying to describe with static variables.  And that’s where part of the problem comes.  We need a number to do our calculations with, but it’s important to understand the factors that affect that number.

Rye Field

Rye field

What do we do now:

What I hope we can do is better educate people. We should teach that we need a value we call field capacity or permanent wilting point, but it’s going to be a dynamic property.  We can start out by saying: our best guess is that it will be -⅓ bar for finer-textured soils and -1/10 bar (-10 kPa) for coarser-textured soils. But when we dig a hole and find out there is layering in the profile or textural discontinuities, we’d better adjust our number.  If we’re dealing with irrigated farmland, the adjustment will always be up, and if we’re dealing with dryland or rain-fed agriculture where the time between water additions is longer, we’ll use a lower number.

Some Ideas Never Die:

One of the contributors to the book, This Idea Must Die, Dr. Steve Levitt, had this to say about outdated scientific ideas, and we agree:  “I love the idea of killing off bad ideas because if there’s one thing that I know in my own life, it’s that ideas that I’ve been told a long time ago stick with me,  and you often forget whether they have good sources or whether they’re real. You just live by them. They make sense. The worst kind of old ideas are the ones that are intuitive. The ones that fit with your worldview, and so, unless you have something really strong to challenge them, you hang on to them forever.”

Harness the power of soil moisture

Researchers measure evapotranspiration and precipitation to understand the fate of water—how much moisture is deposited, used, and leaving the system. But if you only measure withdrawals and deposits, you’re missing out on water that is (or is not) available in the soil moisture savings account. Soil moisture is a powerful tool you can use to predict how much water is available to plants, if water will move, and where it’s going to go.

In this 20-minute webinar, discover:

  • Why soil moisture is more than just an amount
  • Water content: what it is, how it’s measured, and why you need it
  • Water potential: what it is, how it’s different from water content, and why you need it
  • Whether you should measure water content, water potential, or both
  • Which sensors measure each type of parameter

Take our Soil Moisture Master Class

Six short videos teach you everything you need to know about soil water content and soil water potential—and why you should measure them together.  Plus, master the basics of soil hydraulic conductivity.

Watch it now—>

Download the “Researcher’s complete guide to soil moisture”—>

Download the “Researcher’s complete guide to water potential”—>

Double Ring Infiltrometers Versus DualHead Infiltrometers

Several years ago I had the chance to work at the USDA ARS Research Watershed in Riesel, Texas. The goal of my research was to look at the effects of land use and landscape position on water infiltration.  Within the research watershed there is preserved and maintained native prairie, improved pasture, and conventional tilled areas, which have been in existence for 75 years. Thus we were able to use infiltrometers to study the long-term effects of those different land uses, along with the effect of landscape position within the same soil type.

Double Ring Lysimeters

Texas Infiltrometer setup

My research focused on the Houston Black Soil Series, which is a clay-rich soil with a high shrink-swell capacity. This soil type has key economic importance, as it is present in much of Texas’ USDA prime farmland.  To achieve our objectives, we began by mapping soil bulk electrical conductivity using an EM38 device (electromagnetic geo-surveying instrument).  The maps we created allowed us to look for areas of variability in water content, depth to parent material, clay content, and salinity.  Then we randomly selected three zones within the catinas (full hill slope including summit, back slope, and front slope) and flagged them with GPS points.  Our goal was to make infiltration measurements at all of the landscape positions on the slope and compare them to the same landscape positions within each land use type.

We found that the native prairie had the highest infiltration rates because the soil maintained its strong structure and macropores which allowed water to conduct well through the soil.  We also found some differences by landscape position that were consistent within the different catinas.  As water would run down the catina, erosion would transport soil and organic matter off the shoulder and back slope and deposit it on the foot slopes.  Even though they were mapped as the same soil type, the differences in erosion and reduction of organic matter affected the ability of these different positions to transport water.

Double ring infiltrometer chart

We chose to customize existing double ring infiltrometers to make these measurements because there wasn’t anything automated on the market.  If I was going to conduct my research in a reasonable amount of time, I had to come up with a system where I could run a lot of measurements relatively easily.  As a result, we bought three double-ring infiltrometers and modified them with pressure sensors and some larger controlled ports.  The resulting setup was huge; the outer ring on each infiltrometer was 60 cm in diameter and the entire instrument was very heavy.  We were constantly refilling the instrument water reservoirs. In fact, this setup required so much water that we had to pull a 1,900-liter water tank on a trailer wherever we were taking measurements.

Our goal was to save time by running all three infiltrometers concurrently, but it still took a LONG time.  Even though we had automated the instruments, they required a lot of monitoring; sometimes I had to fill our 1,900-liter water tank twice in a day. One measurement at one site took anywhere from 1.5 hours to 3 hours depending on when we reached steady state. We spent so much time out in the field that we were actually caught on film in one of the Google Maps picture flyovers!   Even after all this field time, the data analysis was overwhelming, despite a relatively seamless approach to handle it all.

One huge infiltrometer setup

Our huge setup caught on google maps

I often dreamed of making a tool that would be a lot easier for me and others to use. When I joined Decagon (now METER), it gave me an opportunity to do just that.  Our design goals were to make an infiltrometer that required less water and simplified the data analysis.  We rejected the double ring design in favor of a single ring approach because research has shown that the outer ring doesn’t buffer three-dimensional flow like it’s supposed to. (Swartzendruber D. and T.C. Olson.  “Sand-model study of buffer effects in the double-ring infiltrometer” Soil Sci. Soc. Am. Proc. 25 (1961), 5-8)

We also wanted to simplify the analysis of three-dimensional flow.  With a constant head control in a single ring, there are equations that you use to correct for it.  But you have to guess at things like soil type and structure which leads to inaccuracies.  Multi-head analysis has been around for decades. It involves establishing constant water heights (heads) at multiple levels and looking at the difference in the infiltration rates to calculate the sorptivity. Thus, parameters that are normally estimated from a table can actually be measured, and infiltration results will be independent of users.

Still, there can be problems with the multiple head approach. Increasing the water height when infiltrating into a really low conductivity soil may take 1 to 2 hours to drain back to the original height. We didn’t want to make this measurement take longer than necessary, so instead of using additional water, we used air pressure to simulate higher water levels which can be added or removed very quickly.

So, thanks to the instrument hardships I endured in my past efforts to obtain infiltration measurements, we now have an easy-to-use dual-head infiltrometer (now called the SATURO), that can do the analysis of infiltration rates and saturated hydraulic conductivity on the instrument itself (it gives sorptivity and alpha, based on the soil type and structure, and makes the correction onboard).  Thus, if a scientist needs a value right away, it’s there. But, if like me, they wanted to dig deeper through the data, all the measured values can still be downloaded for more careful analysis.  Together, it’s a simple tool for both scientists and consultants who need to make these measurements.  And they won’t get caught on Google Maps like me, because they’ve had to spend their whole life in the field taking measurements.

Below is a video of the dual-head infiltrometer in action.

Get more information on applied environmental research in our

Download the “Researcher’s complete guide to soil moisture”—>

The History and Future of Water Potential

I often hear researchers complain about the accuracy of our TEROS 21 water potential sensors.  We still have room to improve, but we’ve certainly come a long way! People have been attempting to make water potential measurement in the field for over 100 years. The following is a brief overview of the evolution and history of water potential measurements over that time.

Pre-MPS-1 Prototype

Pre-MPS-1 prototype.

Livingston Discs

The Livingston disc, developed in 1908, was one of the first attempts at determining water potential in the field.  The Livingston Disc was actually a primitive, manual version of the technology used in our MPS6 ceramic disc.  Here is how it worked:  first, you’d weigh the dry disk, then put it in the soil and let it equilibrate.  After that, you would dig it up and weigh it again.  Using the water retention curve of the disc, you could then determine the water potential.

Gypsum block

In the 1940s gypsum block sensors were invented as the first solid matrix equilibrium technique for water potential.  This method tried to continuously sense water potential with a simple electrical conductivity measurement in a solid porous (and naturally occurring) gypsum matrix.  However, because naturally occurring gypsum doesn’t have a consistent pore size distribution and it degrades over time, the instrument was not very accurate.

1940's Gypsum Block Sensors

In the 1940’s gypsum block sensors were invented as the first solid matrix equilibrium technique for water potential. Image: www.soilmoisture.com

Tensiometers

In the 1960’s a liquid equilibration technique called tensiometry was discovered that allowed water potential measurement with good accuracy even in the presence of positive pore water pressures.   Tensiometers work extremely well in wetter soils with water potentials between 0 and -80 kPa and should be the choice for all wet soil applications, especially above -9 kPa where the MPS6 will not work (the air entry value for its ceramic is -9 kPa).  However, when the soil dries out the water under tension in the tensiometer eventually cavitates, causing the output to be useless until they are refilled.  Thus solid equilibrium techniques like the TEROS 21 are the best choice across the dry range.

1960 Tensiometer

Tensiometers are the most accurate way to measure water potential in the field in the wet range, but are limited to the plant optimal range of about -100 kPa and above.

The Evolution of Ceramic Discs

We learned with the gypsum blocks that one of the challenges in solid matrix water potential measurement is finding a material that will create the same water retention curve every time. In quest of this goal, the ceramic discs in sensors like the TEROS 21 have taken years of development.  Because of the limited range of the tensiometer, we wanted to develop a water potential sensor that could measure over a larger range.  The hardest part about developing that ceramic was getting a variety of pore sizes so the instrument could read said wide range of water potentials.  This started years ago in the lab of Dr. Gaylon Campbell at Washington State University where his technician, Kees Calisendorf, experimented over a long period of time to come up with the perfect recipe.

MPS1

The MPS1 was our original matric potential sensor released in 2001. It allowed for long-term monitoring in the field because, unlike gypsum, the ceramic did not degrade over time.

Even after we found a consistent ceramic, there were still outliers.  So creating a calibration method was essential to making an accurate sensor.  The first challenge was to be able to store calibration points in the sensor, which required a microprocessor.  The second, and more difficult task, was to establish a method to calibrate large numbers of sensors at once.  We tried many different approaches like pressure plate, equilibration over salt solutions, and even centrifugal force, but nothing worked.  Finally, in a discussion with our partner, UMS, we discovered the key.  We now can accurately calibrate 50 sensors at a time in only 12 hours.  Still, even with these advanced techniques, we only have a sensor with an accuracy of plus or minus 10%, but considering the history of how hard it’s been to develop consistent ceramic, this accuracy is exciting for the range that we can get.

MPS 2

The MPS 2 was our second matric potential sensor which offered two-point calibration and a temperature sensor, improving accuracy.

What’s Next?

Now that we’ve created a reliable calibration method, we can turn our attention toward further improving the sensor measurement range as well as its accuracy.  Testing different ceramics, or other porous media, may hold the key to a solid equilibrium technique sensor reading all the way to 0 kPa, eventually replacing the need for tensiometers in the field.

TEROS 21

The two key innovations in the MPS6 (now called TEROS 21), released in 2014, are the addition of a microprocessor to the sensor and fast, accurate equilibration at multiple points.

Take our Soil Moisture Master Class

Six short videos teach you everything you need to know about soil water content and soil water potential—and why you should measure them together.  Plus, master the basics of soil hydraulic conductivity.

Watch it now—>

Download the “Researcher’s complete guide to water potential”—>

Download the “Researcher’s complete guide to soil moisture”—>

Get more information on applied environmental research in our

Learn to Measure Water Potential at a Bodentag

One of the best parts of my job is the opportunity I get to teach others about the science and technique of measurement. For more than 10 years, I have participated in seminars and workshops all over the world to do just that.  But, a couple of months ago, I had my first opportunity to work with my good friend Georg von Unold (METER Ag) to do a Bodentag workshop, German-style.  I learned a lot from my experience, and I think the participants did as well.

bodentag

UMS’s Georg von Unold with his backhoe, digging a permanent soil observation pit in the Black Forest

A Bodentag (meaning “soil day” in German) is an unusual opportunity for the attendees to get practical hands-on teaching and training from the people who understand soil and environmental instrumentation.  In a typical conference, you will not get a chance to do things under field conditions.  Instead of sitting in a conference room all day, a Bodentag starts with presentations to set the stage with the theory and principles of measurement, but quickly moves to the lab and field to get the participant’s hands dirty.  With the diversity of measurements required for today’s multidisciplinary research, there is great value in structured field installation familiarity.

Our trip to Freiburg was a great example of how a Bodentag works.  Preparation started early in the morning the day before as Georg used his large Mercedes Sprinter van full of equipment to tow his Bobcat excavator for more than five hours on our drive from Munich.  When we got there, we were directed to a nearby site in the Black Forest where we used the excavator to dig a permanent soil observation pit (Georg’s gift to the institute there), complete with a stairwell that allowed people to go and inspect the pit face and install sensors. We prepared other stations to get people to install soil sensors with minimum impact, cut out intact soil columns for a field lysimeter, and remove intact soil cores.

bodentag

Georg standing in the finished soil observation pit

The day of Bodentag, participants listened to two hours of lecture/presentations in the morning followed by both lab and field practicum sessions. During the field practicum, attendees could do actual installations of sensors into pit faces. This was useful because there were several researchers there who had Black Forest research sites, and they could look at and ask questions about the challenges of the rocky soil pervasive in that region. We used augers to dig holes to install Decagon sensors so everyone could see how that was done. Georg had one of his Smart Field Lysimeters out there and did a half-field installation. He showed them how to dig the Smart Field Lysimeter down into the soil, scrape the soil off, and actually collect a monolith right there.

After the outdoor practicum session, we went back to the lab where we broke up into small groups. There, people had an opportunity to go see laboratory instrumentation while learning some best practices for making measurements. In mine, people were using the WP4C water potential instrument to figure out the permanent wilting point of the soil that we brought. Attendees also got some careful training on the Hyprop to measure the wet end of the moisture release curve as well as learning about the KSAT, a METER instrument which measures saturated hydraulic conductivity. Because Bodentag is an opportunity to share ideas, we also got a chance to see the multi-step outflow instrumentation developed over the past 20 years by the Forest Research Center there in Freiburg that they use to create soil moisture characteristic curves.

bodentag

2014 Bodentag attendees

At the end of the day, everyone was exhausted, and we still had a five-hour drive left to get back to Munich.  But, everyone had a great time, and the students and researchers who were there learned enough so they could be confident when using an instrument to get the data they need in an experiment. It was a unique opportunity for me to see how to put together a great educational experience, and I am excited to try one here in the U.S. sometime soon: especially if I can run the excavator again!

Download the “Researcher’s complete guide to water potential”—>

Download the “Researcher’s complete guide to soil moisture”—>

Get more information on applied environmental research in our