Screen Shot 2017-11-11 at 10.38.16 PM
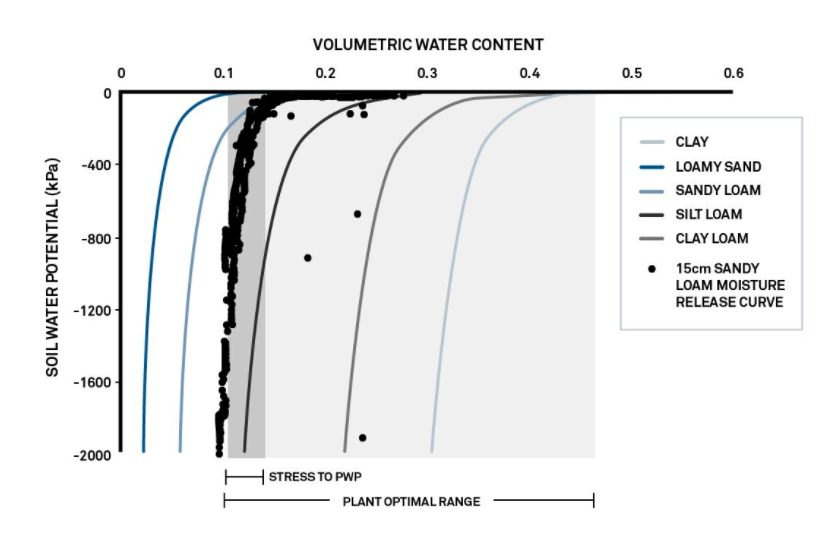
Figure 1. Turfgrass soil moisture release curve (black). Other colors are examples of moisture release curves for different types of soil.
No comments yet
Figure 1. Turfgrass soil moisture release curve (black). Other colors are examples of moisture release curves for different types of soil.


Copyright © 2024 Decagon Devices, Inc.. All rights reserved.